

Eventually, you will have to deal with Descriptive Analysis if you work with datasets for a long enough time. When asked what statistics are, the average person is likely to use terms like “numbers,” “figures,” and “research.” Statistics study involves gathering, classifying, analyzing, interpreting, and presenting numerical facts and data. Statistics is a branch of mathematics. It is beneficial when working with populations that are too big and diverse for precise, in-depth measurements. Statistics are essential when extrapolating general conclusions about a dataset from a data sample. Two additional categories of statistics are descriptive and inferential. Today, we’ll take a closer look at descriptive statistics, including their definition, various subtypes, and how they differ from inferential statistics.
What are Descriptive Statistics?
The fundamental characteristics of a dataset found in a particular study are described, illustrated, and summarised using descriptive statistics. The summary provides details about the data sample and its measurements. It makes it easier for analysts to comprehend the data. The available data sample is what descriptive statistics represent; they do not include theories, inferences, probabilities, or conclusions. Inferential statistics should handle that.
Examples:-
The grade point average of a student is a perfect illustration of descriptive statistics (GPA). A GPA compiles the data points generated by a wide range of grades, classes, and exams, averages them all, and then gives an overall impression of the student’s average academic performance. Please note that the GPA neither presents conclusions nor forecasts future performance. Instead, based on values derived from data, it presents a clear summary of students’ academic success.
Here is an even more straightforward example. Assume that the sum of the data set of 2, 3, 4, 5, and 6 is 20. The mean of the data set is four and was calculated by dividing the total by the number of values (20 divided by 5 equals 4). To present descriptive statistics, analysts frequently use graphs and charts. Descriptive statistics could be demonstrated by asking 50 moviegoers outside a theatre if they enjoyed the film they had just seen and then plotting the results on a pie chart.
In this case, descriptive statistics count the yes and no responses to determine how many viewers in this particular theatre liked or disapproved of the film. We’ll cover that topic later. If you tried to draw any other conclusions, you would be straying into the realm of inferential statistics.
What is Descriptive Analysis?
Descriptive analysis is a type of data analysis that aids in accurately describing, displaying, or summarising data points so that patterns may appear that satisfy all of the data’s requirements. It is one of the most crucial steps in analyzing statistical data. It provides you with an analysis of the distribution of your data, aids in detecting errors and outliers, and enables you to spot patterns between variables, preparing you for further statistical analysis.
Type of Descriptive Analysis
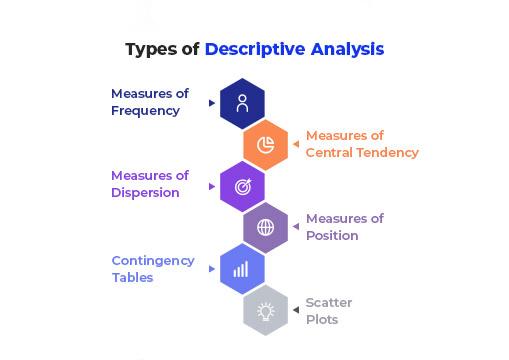
There are four different types of descriptive analysis: measures of frequency, central tendency, dispersion or variation, and position. These techniques work best when only one variable is present.
- Measures of Frequency – Understanding how frequently a specific event or response is likely to occur is crucial for descriptive analysis. The main goal of frequency measurements is to create something akin to a count or a percentage. Think about a survey where 500 people are questioned about their favorite IPL team. A list of 500 responses would be challenging to read and organize, but by counting the number of times a specific IPL team was chosen, the data can be made much more understandable.
- Measures of Central Tendency: It’s crucial to identify the Central (or average) Tendency or Response when conducting a descriptive analysis. The mean, median, and mode averages are used to calculate central tendency. Think about a survey where 1,000 people’s weights are recorded as an example. The mean average would be a tremendous descriptive metric to use in this situation to measure mid-values.
- Measures of Dispersion – At times, understanding how data is distributed across a range is crucial. Consider the average weight of a sample of two people to explain this further. The average weight will be 60 kilograms if both people weigh 60 kilograms. The average weight is still 60 kg even if one person weighs 50 kg and the other 70 kg. This type of distribution can be measured using dispersion metrics like range or standard deviation.
- Measures of Position – Identifying the position of a single value or its response to others is another aspect of descriptive analysis. In this field of expertise, metrics like percentiles and quartiles are beneficial.
Advantages of Descriptive Analysis
- One of the main benefits of descriptive analysis is the researchers’ high level of objectivity and neutrality. Descriptive analysis reveals various characteristics of the data extracted. If the data don’t match the trends, it will result in significant data dumping, so researchers need to be extra vigilant.
- Compared to other quantitative techniques, descriptive analysis is more thorough and presents a more comprehensive picture of an event or phenomenon. To conduct a descriptive study, any number of variables, or even just one, may be used.
- This kind of analysis is thought to be a better way to gather data that depicts relationships as natural and reflects the real world. Because all trends were created after research into the actual behavior of the data, this analysis is very grounded in reality and human experience.
- It is thought to help locate variables and brand-new theories that can be investigated further through experimental and inferential studies. The margin for error is minimal because we are directly extracting the trends from the data properties, making it worthwhile. When conducting this kind of study, the researcher has the freedom to learn about population characteristics using both quantitative and qualitative data. For instance, researchers can describe a phenomenon using correlation analysis and a case study, which is a qualitative analysis. The researcher can fully comprehend the behavior and pattern of the concerned set by using case studies to describe individuals, events, and institutions.
- In contrast to experimental studies, which typically require smaller samples, the researcher tends to collect data points from a relatively large number of samples when conducting surveys, one of the primary types of descriptive analysis. The survey method has a particular advantage over other descriptive methods in that it makes it simple for researchers to examine larger populations of people.
- If the surveys are appropriately conducted, they provide a more thorough and organized description of the research unit. For instance, researchers can describe a phenomenon using correlation analysis and a case study, which is a qualitative analysis. The researcher can fully comprehend the behavior and pattern of the concerned set by using case studies to describe individuals, events, and institutions.
Descriptive Analysis in R
Descriptive Analysis in R help summarise, present, and describe data most straightforwardly. They are frequently referred to as the crucial initial step in statistical analysis. The majority of the time, an analyst will dig through the data and then present some descriptive statistics to the user before beginning an actual analysis. We can understand it thanks to descriptive statistics with a glance at the data. They are the best options available for comprehending the data. They can be a better introduction to more in-depth or sophisticated statistical analysis if carried out correctly.
You may also like to read about – Data Analysis With R
Descriptive Analysis in Python
The Python Descriptive Analysis process describes the essential characteristics of data in a study. It does not use the data to find out more about the population it represents; instead, it provides summaries of the sample and the measures. Two properties—central tendency and dispersion—fall under descriptive statistics. Python One central value for the entire distribution is what central tendency means. The mean, median, and mode are examples of measures under this. Python The term “dispersion” refers to a practice that describes how far the distribution’s constituent parts are from the center and one another. Variance/Standard, One such indicator of variability is deviation.
Conclusion
By describing the relationship between variables in a sample or population, descriptive statistics are used to summarise data. Making inferential statistical comparisons should only occur after calculating descriptive statistics, which is an essential first step in conducting research. In addition to measures of frequency, central tendency, dispersion/variation, and position, descriptive statistics also include types of variables (nominal, ordinal, interval, and ratio). Descriptive statistics reduce data into a more manageable summary, allowing healthcare decision-makers to evaluate particular populations.

This blog provides the details of descriptive analysis in an easy-to-understand manner.
From the basic explanation to the classification, it will progress steadily in a chain. For the layman, it breaks down most of the knowledge into step-by-step tasks.
Using relevant examples, descriptive images, and a table of contents with headings makes the site very user-friendly.
Even if you don’t have a technical background, I think it’s an absolutely useful blog for someone reading for the first time on a particular topic.
Keep Going! The Series is of Great Help