What is Statistical Data Analysis?
Statistical data analysis is collecting and analyzing data to discern patterns and trends. It is a process to remove bias from evaluating data by employing numerical analysis. It helps collect the interpretations of research, develop statistical models, and plan surveys and studies.
Statistical data analysis is a scientific tool that assists in collecting and analyzing large amounts of data to identify common patterns and trends for converting them into meaningful information. Simply put, it is a tool that helps draw meaningful results from raw and unstructured data.
Importance of Statistical Data Analysis
Statistical data analysis is an essential tool for decision-making in different fields. For example, in business, it helps organizations to make informed decisions based on data-driven insights. It helps businesses to identify trends, patterns, and relationships in their data, which can help them to improve their operations, identify new opportunities and mitigate risks.
- In healthcare, statistical data analysis is used to monitor and evaluate patient outcomes, identify risk factors, and measure the effectiveness of different treatments. It helps healthcare providers to make informed decisions about patient care, and it also helps policymakers to allocate resources efficiently.
- In social sciences, statistical data analysis is used to study human behavior, attitudes, and trends. It helps researchers to test hypotheses, identify patterns, and draw conclusions about different phenomena. It is also used to evaluate the effectiveness of policies and interventions in different social contexts.
You may also like to read about – A Career Guide to Business Analyst
Key Objective of Statistical Data Analysis?
Data analysis can be described as gathering, modeling, and transforming data to get helpful and meaningful information, suggestions, and results in decision-making. when the Appropriate analytical tools are used to convert raw data into information that can use in marketing research. Percentiles and ratios are some elementary methods of data analysis. s should use statistical data analysis methods such as mean, median, mode, percentage, and standard deviation per requirement.
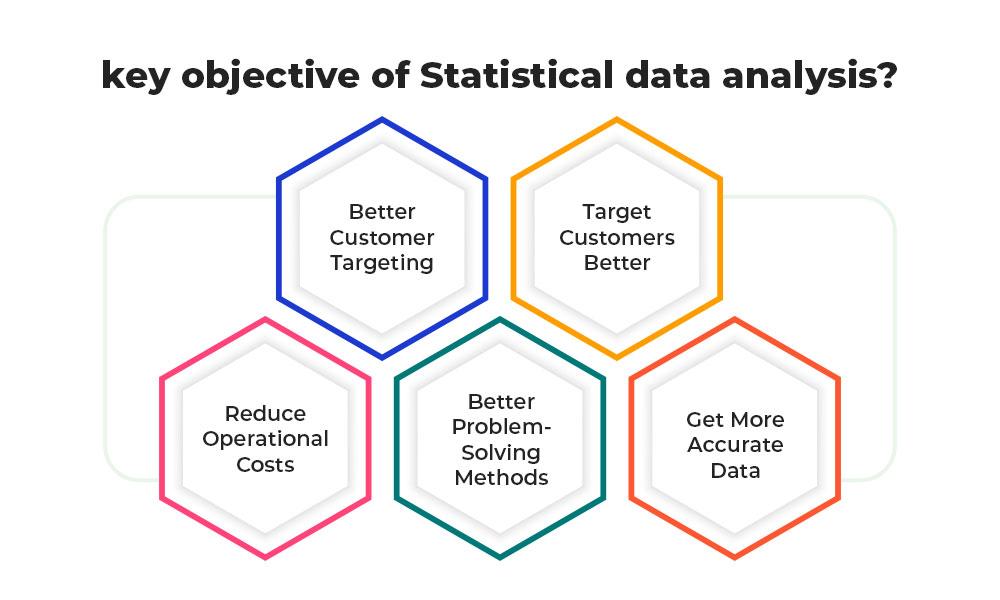
- Better Customer Targeting: what is a key objective of data analysis is answered through You don’t want to waste your precious business time, resource, and money put in together for advertising campaigns targeted at demographic groups with minimum or no interest in the goods and services you offer. Data analysis assists you see where you should focus on your advertising efforts.
- Target Customers Better: Data analysis tracks how well the products and campaigns perform inside your target demographic. The business can better understand the target audience’s spending habits, disposable income, and most likely regions of interest through data analysis. This Data assists the businesses set prices, determining the length of ad campaigns, and projecting the number of goods needed.
- Reduce Operational Costs: What is the key objective of data analysis? The reduction of operational costs in Data analysis shows you which areas in your business require more resources and money and which regions do not produce and thus should be scaled back or eliminated outright.
- Better Problem-Solving Methods: Informed decisions are most likely to be successful decisions. Data gives businesses information. The business can see where this progression leads to. Data analysis assists businesses in making the right decisions and avoiding expensive pitfalls.
- Get More Accurate Data: If you want to make informed decisions, you need data, but there’s more. What is key objective of data analysis as the data in question must be to the point. Data analysis assists businesses in acquiring relevant, accurate information suitable to develop future marketing strategies and business plans and realign the company’s vision or mission.
Benefits of Statistical Data Analysis
Statistical data analysis can be a boon to humankind and has multiple advantages for individuals and organizations. Given below are some of the reasons why you should consider investing in statistical data analysis:
- It can assist you in determining the monthly, quarterly, and yearly figures of sales profits and the cost of making it simpler to make your decisions.
- It can assist you in creating informed and correct decisions.
- It can assist you in identifying the problem or causing of the failure and making corrections.
- It can assist you in conducting market analysis and making an effective marketing and sales strategy.
- It creates in improving the efficiency of various processes.
Types of Statistical Data Analysis
Statistical data analysis involves different analyses depending on the research question and the data collection type. Here are some of the common types of statistical data analysis:
Descriptive Statistics
Descriptive statistics involves summarizing and describing the characteristics of the data, such as the mean, median, mode, standard deviation, variance, range, and interquartile range. Descriptive statistics provide a better understanding of the data and help to identify trends and patterns.
For example, if you want to analyze the height of students in a class, you can use descriptive statistics to calculate the mean, median, and standard deviation of their heights.
Inferential Statistics
Inferential statistics involves using the sample data to make inferences about the population. It involves hypothesis testing, confidence intervals, and the estimation of parameters. Inferential statistics is useful when the data collected from a sample is used to make conclusions about the population.
For example, suppose you want to test whether the mean height of students in a class significantly differs from that of students in another class. In that case, you can use inferential statistics to make this comparison.
Regression Analysis
Regression analysis is a type of statistical data analysis that examines the relationship between two or more variables. It involves creating a model that predicts the value of a dependent variable based on the values of independent variables.
For example, if you want to analyze the relationship between the height of students and their weight, you can use regression analysis to create a model that predicts a student’s weight based on their height.
Time Series Analysis
Time series analysis is a type of statistical data analysis that examines trends and patterns in data over time. It involves analyzing data collected regularly over time, such as daily, weekly, monthly, or yearly.
For example, if you want to analyze the trend in a company’s stock prices over time, you can use time series analysis to identify patterns and trends in the data.
Cluster Analysis
Cluster analysis is a type of statistical data analysis that groups similar observations or data points into clusters or subgroups. It involves identifying patterns and relationships in data that are not apparent in the raw data.
For example, if you want to group customers into segments based on their purchasing behavior, you can use cluster analysis to identify common characteristics among different customer groups.
Factor Analysis
Factor analysis is a type of statistical data analysis that examines the relationships between multiple variables to identify underlying factors or dimensions. It involves analyzing the correlations between different variables to identify common factors.
For example, suppose you want to analyze the factors that influence customer satisfaction. In that case, you can use factor analysis to identify the underlying dimensions contributing to customer satisfaction, such as price, quality, and customer service.
Steps in Statistical Data Analysis
The process of statistical data analysis involves several steps, as outlined below:
- Defining the Research Question: The first step in statistical data analysis is to define the research question or problem that needs to be addressed. The research question should be specific, measurable, and relevant to the field. It should also be framed in a way that can be answered through data analysis.
- Collecting the Data: The next step is to collect the relevant data for the research question. The data can be collected through various sources, including surveys, experiments, observational studies, and administrative records. The data should be collected to minimize bias and maximize its representatives.
- Cleaning and Formatting the Data: The data collected may contain errors, inconsistencies, and missing values. Therefore, cleaning and formatting the data before analyzing it is essential. Data cleaning involves identifying and correcting errors, removing outliers, and imputing missing values.
- Communication and Reporting: The final step in statistical data analysis is communicating the results and reporting the findings. The results should be communicated in an understandable and relevant way to the audience. It should also include recommendations based on the analysis.
Statistical Data Analysis Tools
Statistical data analysis tools are software applications that help researchers, data analysts, and statisticians analyze, visualize, and interpret data. These tools are essential in statistical data analysis as they help to automate the analysis process and provide a more accurate and reliable analysis. Here are some standard statistical data analysis tools:
SPSS
SPSS (Statistical Package for the Social Sciences) is a popular statistical data analysis tool used in social sciences, healthcare, and business. It offers various statistical analysis features, including descriptive statistics, inferential statistics, regression analysis, factor analysis, and cluster analysis. It also allows for data visualization, data mining, and reporting.
SAS
SAS (Statistical Analysis System) is a powerful statistical data analysis tool in research, finance, and healthcare. It offers a wide range of data management, analysis, and reporting features. SAS is known for its ability to handle large datasets and complex analyses.
R
R is a popular open-source statistical data analysis tool in research, academia, and industry. It offers various statistical analysis features, including descriptive statistics, inferential statistics, regression analysis, time series analysis, and data visualization. R is known for its flexibility, scalability, and ease of use.
Excel
Excel is a widely used spreadsheet program that offers basic statistical data analysis features, including descriptive statistics, inferential statistics, and regression analysis. Excel is easy to use and widely available, making it a popular choice for small data analysis projects.
Python
Python is an open-source programming language that offers a wide range of statistical data analysis features, including data manipulation, statistical modeling, and data visualization. Python is widely used in research, data science, and machine learning.
Tableau
Tableau is a data visualization tool that helps users to create interactive dashboards, reports, and charts from their data. It offers visualization features, including heat maps, scatter plots, and bar charts. Tableau is easy to use and offers a drag-and-drop interface
Conclusion
Statistical data analysis and the tools used to conduct it are essential components of modern research and data analysis. Researchers should carefully consider the type of analysis and the appropriate tool to use to ensure accurate and meaningful results. With the continued advancement of technology and data analysis methods, the use of statistical data analysis tools will continue to grow in importance and impact in a wide range of fields.