What is Data Analytics Life Cycle?
In today’s digital world, data is of excellent significance importance. It undergoes many stages throughout life, during its creation, tests, processes, consumption, and reuse. The Data Analytics Life Cycle maps out the locations for professionals working on data analytics projects. These phases are arranged in a circular structure that forms a Data Analytics Life Cycle. Each step has its significance and characteristics.
Why is Data Analytics Lifecycle Essential?
The Life cycle of Data Analytics is designed to be used with significant big data projects. It is used to portray the actual project correctly; the cycle is iterative. A step-by-step technique is needed to arrange the actions and tasks involved in gathering, processing, analyzing, and reusing data to explore the various needs for assessing the information on big data. Data analysis is modifying, processing, and cleaning raw data to obtain a valuable, significant statement that supports business decision-making.
You may also like to read about – How to make a Career in Data Analytics
Importance of life cycle of data analytics
The life cycle of Data Analytics defines the roadmap of how data is generated, collected, processed, used, and analyzed to achieve business goals. It offers a systematic way to manage data for converting it into information that can use to fulfil organizational and project goals. The process provides the direction and methods to extract information from the data and proceed in the right direction to accomplish business goals.
Data professionals use the lifecycle’s circular form to proceed with data analytics in either a forward or backward direction. Based on the newly received insights, they can decide whether to proceed with their existing research or scrap it and redo the complete analysis. The life cycle of Data Analytics guides them throughout this process.
Life Cycle of Data Analytics Phases

The life cycle of Data analytics was designed to address Big Data problems and data science projects. The process is repeated to show the actual projects. The step-by-step methodology is required to plan the various tasks associated with the acquisition, processing, analysis, and recycling of data to address the specific demands for analyzing Big Data.
Let us discuss the various phases of the data analytics life cycle.-
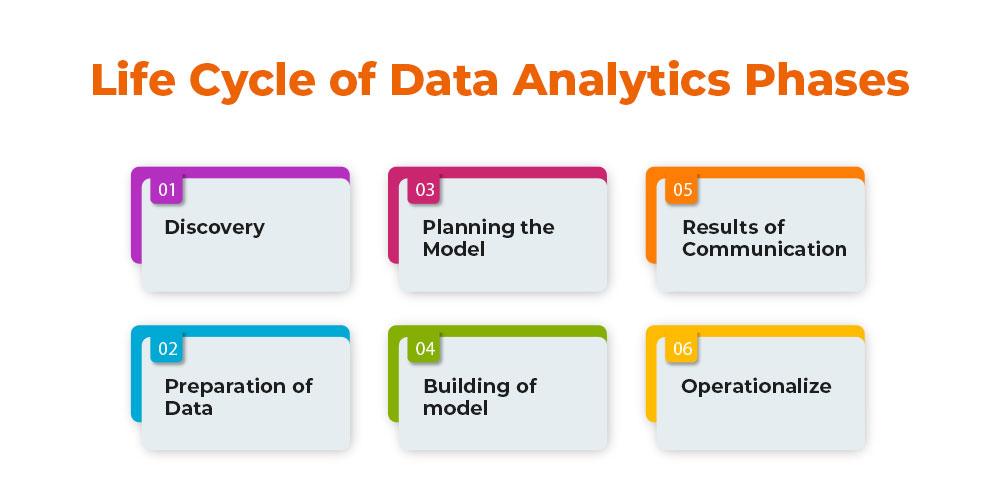
This guide talks about the fundamental phases of each data analytics process. Hence, they are more likely to present in most data analytics projects’ lifecycles. The Data Analytics lifecycle primarily consists of 6 phases
Phase 1: Discovery
- The data science team is trained and researches the issue.
- Create context and gain understanding.
- Learn about the data sources that are needed and accessible to the project.
- The unit comes up with an initial hypothesis, which c can later confirm with evidence.
Phase 2: Preparation of Data
- Methods to investigate the possibilities of pre-processing, analyzing, and preparing data before analysis and modelling.
- It is required to have an analytic sandbox. The team performs, loads, and transforms to bring information to the data sandbox.
- Data preparation tasks can be repeated and not in a predetermined sequence.
- Some of the tools used commonly for this process include – Hadoop, Alpine Miner, Open Refine, etc.
Phase 3: Planning the Model
- The team studies data to discover the connections between variables. Later, it selects the most significant variables and the most effective models.
- In this phase, the data science teams create data sets that c can use for testing, production, and training goals.
- The team builds and implements models based on the work completed in the modelling planning phase.
- Some of the tools used commonly for this stage are MATLAB and STATISTICA.
Phase 4: Building of model
- The team creates datasets for training, testing as well as production use.
- The team is also evaluating whether its current tools are sufficient to run the models or if they require an even more robust environment to run models.
- Devices that are free, open-source, or free tools Rand PL/R, Octave, WEKA.
- Commercial tools – MATLAB, STATISTICA.
Phase 5: Results of Communication
- Following the execution of the model, team members will need to evaluate the model’s outcomes to establish criteria for the success or failure of the model.
- The team is considering how best to present findings and results to the various members of the team and other stakeholders while considering cautionary tales and assumptions.
- The team should determine the most important effects, quantify their value to the business and create a narrative to present findings and summarize them to all stakeholders.
Phase 6: Operationalize
- The team distributes the benefits of the project to a broader audience. It sets up a pilot project that will deploy the work controlled before expanding the project to the entire enterprise of users.
- This technique allows the team to gain insight into the performance and constraints related to the model within a production setting at a small scale and then make necessary adjustments before full deployment.
- The team produces the last reports, presentations, and codes.
- Open source or free tools such as WEKA, SQL, MADlib, and Octave.
You may also like to read: What is Data Science? – Use of Data Science in Real Life
The life cycle of data analytics examples
Consider an example of a retail store chain that wants to optimize its products’ prices to boost its revenue. The store chain has thousands of products over hundreds of outlets, making it a highly complex scenario. Once you identify the store chain’s objective, you find the needed data, prepare it, and go through the Data Analytics lifecycle process.
You observe different types of customers, such as ordinary customers and customers like contractors who buy in bulk. According to you, treating various types of customers differently can give you the solution. However, you don’t have enough information about it and need to discuss this with the client team.
In this case, you need to get the definition, find data, and conduct hypothesis testing to check whether various customer types impact the model results and get the correct output. Once you are convinced with the model results, you can deploy the model and integrate it into the business, and you are all set to deploy the prices you think are the most optimal across the store’s outlets.
CONCLUSION
The life cycle of the data analytics circular process consists of 6 primary stages that dictate how information is created, collected, processed, used, and analyzed. Mapping out business objectives and striving towards achieving them will guide you through the rest of the stages.


