What is an Outlier? A Definition
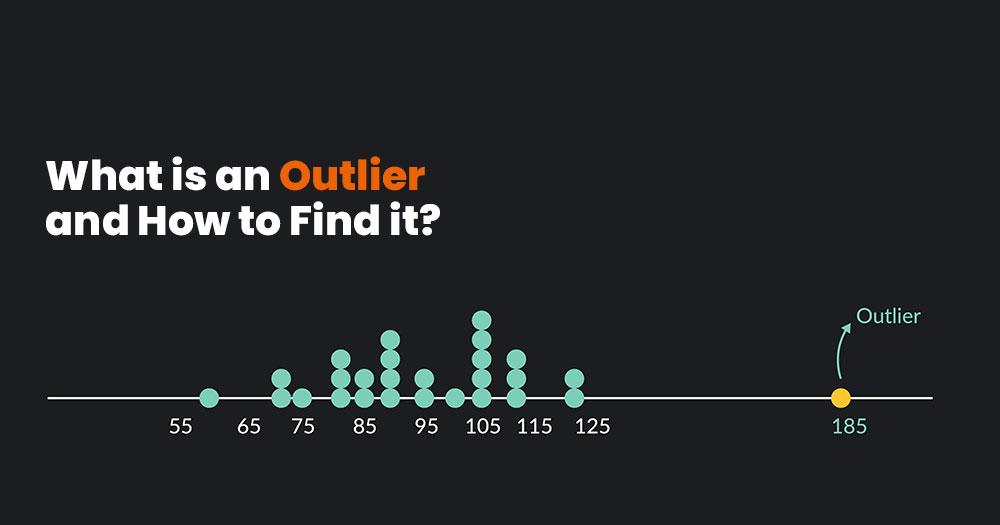
An Outlier in Statistics is a data point or observation significantly different from other data points in a dataset. Outliers are data values that are much larger or smaller than the other values in the dataset and can affect the results of statistical analyses. Outliers can be caused by various factors such as measurement errors, data entry errors, or natural variability in the data.
Outliers can significantly impact statistical analysis, such as affecting the mean and standard deviation of the data. Therefore, it is important to identify and address outliers in a dataset. There are various methods for identifying outliers, such as using visualization techniques like boxplots or scatterplots or statistical methods like the Z-score or the interquartile range (IQR). Once outliers have been identified, the analyst can decide whether to remove them from the dataset, transform them, or analyze them separately. It’s important to note that removing outliers from the dataset should be done carefully, as removing too many outliers can result in a biased analysis.
Types of Outliers in Statistics
In statistics, outliers can be classified into three main types:
Univariate Outliers
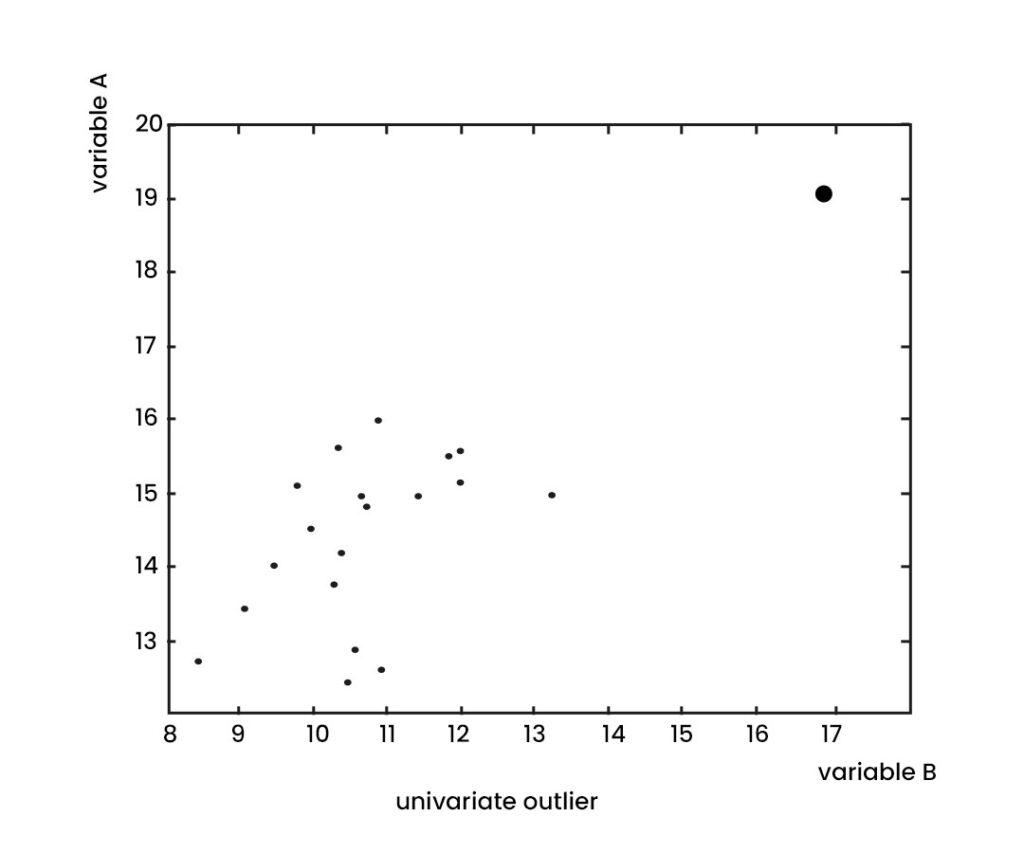
Univariate outliers are extreme data points concerning the distribution of a single variable in a dataset. In other words, univariate outliers are observations that fall far from the typical values of the variable without considering the relationship with other variables in the dataset. Univariate outliers can arise due to various reasons, such as measurement errors, data entry errors, or extreme values in the underlying population. Univariate outliers can significantly impact the analysis of a single variable, such as the mean, median, or standard deviation.

Z-score measures how many standard deviations a data point is from the mean, and a value above a certain threshold, such as 2 or 3, may be considered an outlier. A box plot shows the distribution of a variable and identifies outliers as points that fall outside the whiskers, representing a certain range of the distribution. univariate outliers can be handled in various ways, such as removing them from the dataset, replacing them with a more representative value, or transforming the data to reduce the impact of the outliers. The appropriate approach depends on the nature of the data and the goals of the analysis.
Multivariate Outliers
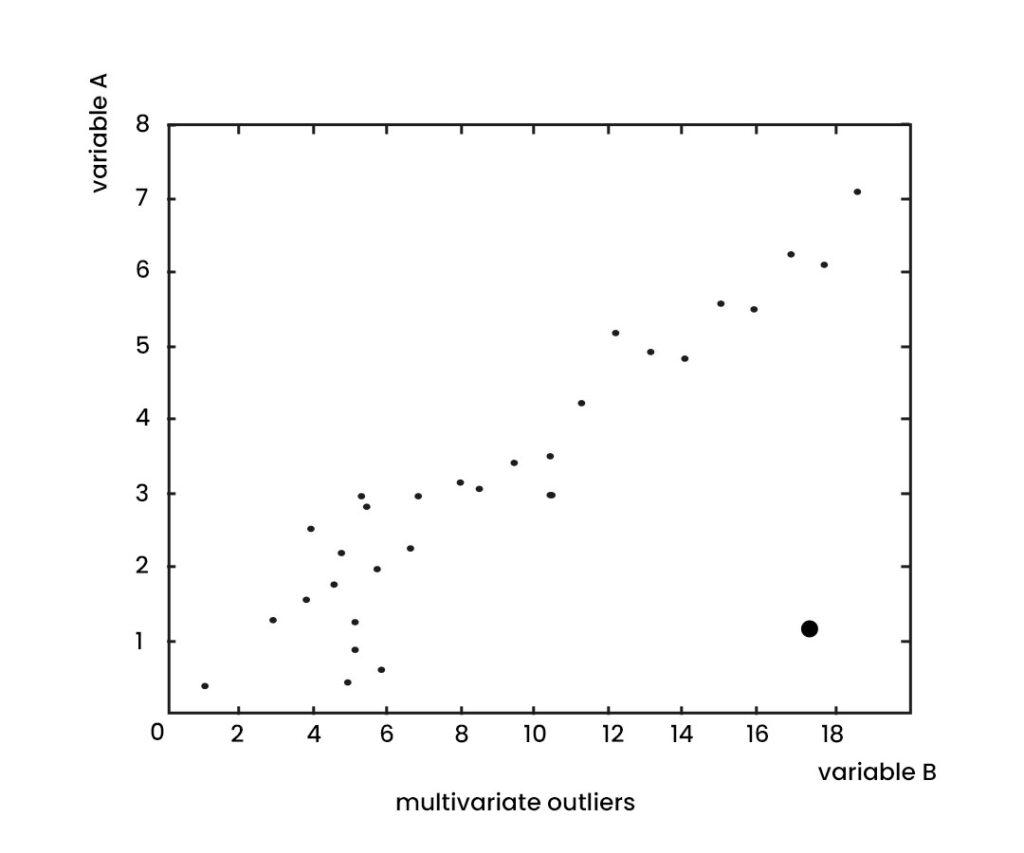
Multivariate outliers are extreme observations about the distribution of multiple variables in a dataset. In other words, multivariate outliers are unusual data points in their combination of values across two or more variables, and not just about a single variable. Multivariate outliers can arise for various reasons, such as measurement errors, data entry errors, or extreme values in the underlying population. In addition, multivariate outliers can significantly impact the analysis of the relationships between variables, such as correlations, regression, or clustering.

Mahalanobis distance measures the distance of a data point from the mean of the variables, considering the covariance between variables. Cook’s distance measures a data point’s influence on a statistical model’s parameters, such as a regression model. Once identified, multivariate outliers can be handled in various ways, such as removing them from the dataset, replacing them with a more representative value, or adjusting the analysis to account for the presence of outliers. The appropriate approach depends on the nature of the data, the goals of the analysis, and the impact of the outliers on the results.
Influential Outliers
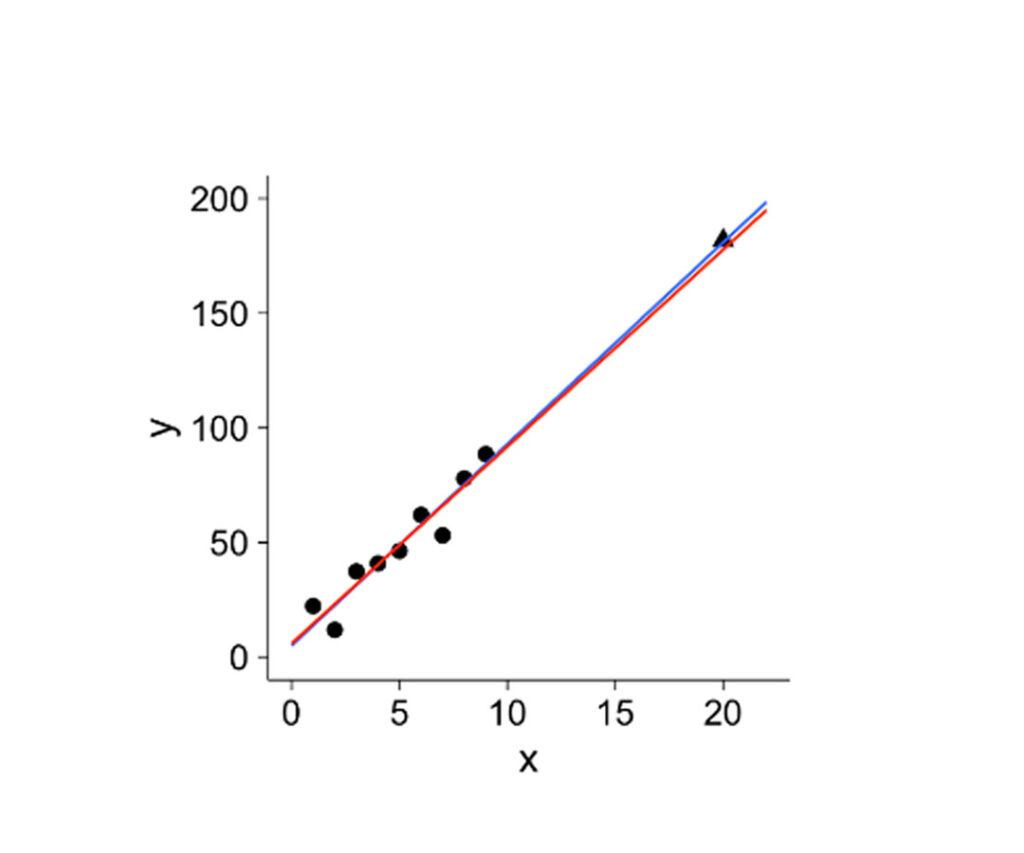
Influential outliers are data points that significantly impact the results of statistical analysis, especially in regression analysis. For example, influential outliers can affect the estimation of regression coefficients, the prediction of new values, and the determination of the fit and accuracy of the model. An influential outlier is not only an outlier with the distribution of the variables but also has a large leverage on the regression line, meaning that it has a disproportionate influence on the slope and position of the line. For example, this can occur when an outlier has a high value on one predictor variable and a low value on another, leading to a large deviation from the regression line.

Cook’s distance measures the change in the regression coefficients when a data point is removed from the analysis, and a high value indicates a strong influence of the data point. Leverage measures the distance of a data point from the mean of the predictor variables, and a high value indicates a potential influence on the regression line. Once identified, influential outliers can be handled in various ways, such as removing them from the dataset, transforming the variables, or using robust regression techniques less sensitive to outliers. The appropriate approach depends on the nature of the data, the goals of the analysis, and the impact of the outliers on the results.
How to Find Outliers?
Now that you know the different types of outliers, let’s learn how to identify them in your datasets. If you’re dealing with small datasets, it’s easy to identify outliers manually by simply looking at the data. However, for larger datasets or big data, additional tools are required.
These methods include visualizations and statistical techniques, but many others can be implemented in your data analytics process. The choice of method will depend on the type of dataset and tools being used.
You may also like to read: About Outlier Treatment
How to Identify Outliers using Visualizations?
Visualizations can be a useful tool for identifying outliers in a dataset.
Here are some ways to use visualizations to identify outliers:
- Scatter plot: A scatter plot can visualize a dataset’s relationship between two variables. Outliers can often be identified as points far away from the rest of the data points.
- Box plot: A box plot can be used to visualize the distribution of a variable in a dataset. Outliers can often be identified as points outside the box plot’s whiskers.
- Histogram: A histogram can be used to visualize the frequency distribution of a variable in a dataset. Outliers can often be identified as bars that are significantly taller or shorter than the other bars.
- Heat map: A heat map can visualize a dataset’s relationship between multiple variables. Outliers can often be identified as cells that are significantly darker or lighter than the other cells.
How to Identify Outliers using Statistical Methods?
Statistical methods can also be used to identify outliers in a dataset.
Here are some commonly used statistical methods for identifying outliers:
- Z-score: The Z-score measures how many standard deviations a data point is from the variable’s mean. A Z-score greater than 3 or less than -3 is often considered an outlier.
- Interquartile range (IQR): The IQR is the difference between the 75th and 25th percentile. Data points over 1.5 times the IQR above the 75th percentile or below the 25th percentile are often considered outliers.
- DBSCAN: DBSCAN is a clustering algorithm that can be used to identify outliers. The algorithm identifies clusters of data points based on their density, and data points not part of any cluster are considered outliers. DBSCAN works by defining a neighborhood around each data point and then identifying clusters of data points with a high density of neighboring data points. Data points that are not part of any cluster are considered outliers.
Why is Finding Outliers Important?
Finding outliers is important for several reasons:
- Data quality: Outliers can indicate data entry errors, measurement errors, or other anomalies in the data that need to be investigated and corrected. Identifying outliers can help improve the quality and accuracy of the data.
- Statistical analysis: Outliers can have a significant impact on statistical analysis, such as skewing the mean or standard deviation, reducing the power of hypothesis tests, or distorting the results of regression models. Removing or adjusting outliers can improve the validity and reliability of the statistical analysis.
- Machine learning: Outliers can affect the performance of machine learning models, such as causing overfitting, reducing the predictive accuracy, or biasing the model towards the outliers. Handling outliers appropriately can improve the robustness and generalizability of machine learning models.
- Decision making: Outliers can have important implications for decision-making, especially in contexts such as finance, healthcare, or safety, where extreme values may signal high risk or opportunity. Identifying and analyzing outliers can help inform better decision-making and risk management.
Impacts of Outliers on a Dataset
Outliers can significantly impact a dataset and the results of data analysis.
Here are some of the impacts of outliers on a dataset:
- Skewed distribution: Outliers can affect the distribution of a dataset, making it skewed towards the extreme values. This can lead to biased statistical measures, such as the mean and standard deviation, which may not accurately reflect the central tendency and variability of the data.
- Model accuracy: Outliers can affect the accuracy of predictive models. For example, if a regression model is built on a dataset that contains outliers, the model may be skewed towards the extreme values, leading to inaccurate predictions.
- Statistical significance: Outliers can affect the statistical significance of the results. For example, an outlier in a group comparison analysis may inflate the difference between groups and lead to a false positive result.
- Data visualization: Outliers can also affect data visualization. For example, a box plot may be distorted if there are outliers, making it difficult to interpret the central tendency and variability of the data.
Outlier in Statistics Treatment
Treating outliers in a dataset is an important step in data analysis as outliers can significantly impact the results of statistical analysis and modeling.
Here are some common approaches to dealing with outliers:
- Removal: One simple approach is to remove the outliers from the dataset. This approach is appropriate if the outliers are clearly due to measurement errors or other anomalies and are not representative of the underlying population. However, removing outliers may also reduce the dataset’s size and affect the remaining data’s representativeness.
- Winsorization: This technique involves replacing the extreme values with the values at a certain distribution percentile. For example, the upper and lower values can be replaced with the 95th and 5th percentile values, respectively.
- Transformation: Another approach is to transform the data to reduce the impact of outliers. For example, taking the logarithm or square root of the data may reduce the impact of extreme values.
- Robust statistics: Robust statistical techniques are less sensitive to outliers than traditional statistical methods. For example, the median can be used instead of the mean, or non-parametric methods such as the Mann-Whitney U test or Kruskal-Wallis test can be used instead of the t-test or ANOVA.
Outlier Treatment in Python
Outlier treatment refers to identifying and handling a dataset’s extreme values (outliers). Outliers can negatively affect the data’s analysis and interpretation; therefore, it is important to identify and handle them properly.
Here are some common techniques for outlier treatment in Python:
Z-score Method
A Z-score method is a statistical approach that involves calculating the standard deviation of the data and identifying values that are more than 3 standard deviations away from the mean. These values are considered outliers and can be removed from the dataset.
from scipy import stats

import numpy as np

z_scores = stats.zscore(data)

abs_z_scores = np.abs(z_scores)

filtered_entries = (abs_z_scores < 3).all(axis=1)

new_data = data[filtered_entries]
Interquartile Range (IQR) Method
This method involves calculating the difference between the 75th percentile (Q3) and 25th percentile (Q1) of the data and then identifying values that are more than 1.5 times the IQR away from Q1 and Q3.
These values are considered outliers and can be removed from the dataset.
Q1 = data.quantile(0.25)

Q3 = data.quantile(0.75)

IQR = Q3 - Q1

filtered_entries = ((data >= (Q1 - 1.5 * IQR)) & (data <= (Q3 + 1.5 * IQR)))

new_data = data[filtered_entries]
Winsorizing Method
This methond involves replacing extreme values with the nearest values that are not considered outliers. This is done by replacing values above a certain threshold with the value at that threshold, and replacing values below a certain threshold with the value at that threshold.
from scipy.stats.mstats import winsorize

winsorized_data = winsorize(data, limits=[0.05, 0.05])

Clipping method: This method involves replacing values above or below a certain threshold with that threshold value.

import numpy as np

clipped_data = np.clip(data, lower_threshold, upper_threshold)
Conclusion
Outliers are data points that are unusual or extreme with the rest of the dataset. Outliers can arise for various reasons, such as measurement errors, data entry errors, or extreme values in the underlying population. There are several types of outliers, including univariate, multivariate, and influential, each with different characteristics and impacts on statistical analysis. Outliers can have several impacts on data analysis, including distorting the mean and standard deviation, reducing the power of hypothesis tests, biasing regression models, and affecting the performance of machine learning models.
Therefore, it is important to identify and handle outliers appropriately in data analysis to ensure data quality, improve statistical analysis and machine learning, and support better decision making. Various methods can be used to identify and handle outliers, including visual inspection, statistical measures, and data transformation techniques. The appropriate approach depends on the nature of the data, the goals of the analysis, and the impact of the outliers on the results.


This was surely a boost to my knowledge
Very well explained!!
Boost to my knowledge
This topic has been explained so well! Kudos to the team for presenting the content in such a coherent manner- really loved it!
Really Informative. Thanks 🙂
REALLY NICE
The Data Visualization using Python course was an outstanding learning experience that provided me with valuable insights and techniques for creating compelling visualizations. The course was well-organized and covered a broad range of topics, from basic chart types to advanced visualization methods such as geospatial mapping and time-series analysis.
The instructor was knowledgeable and approachable, and the course materials were excellent, with clear explanations and practical examples. I appreciated the hands-on approach of the course, which included regular assignments and projects that allowed me to apply the concepts learned in the lectures to real-world data.
I would highly recommend the Data Visualization using Python course to anyone looking to enhance their data visualization skills. The course is an excellent investment for those looking to improve their data analysis and communication abilities, and the knowledge gained will undoubtedly be valuable in any data-related role.
Worthy and well explained
Well explained and very informative
Well explained and informative
Much insightfull and knowledgeable content