
Introduction to Statistics
Statistics, a branch of mathematics, focuses on collecting, examining, and interpreting data. In data science, statistics holds a significant place as it facilitates extracting valuable insights and making well-informed decisions based on the available data.
Using statistical techniques, data scientists can characterize and condense data, recognize patterns and correlations, and anticipate future trends. These techniques help make sense of complex data and provide a deeper understanding of the underlying relationships in the data.
What is Inferential statistics?
Inferential statistics is a branch of statistics that deals with making inferences about a population based on a sample of data from that population. The goal of inferential statistics is to make generalizations about a larger group of individuals or objects based on the characteristics observed in a smaller sample.
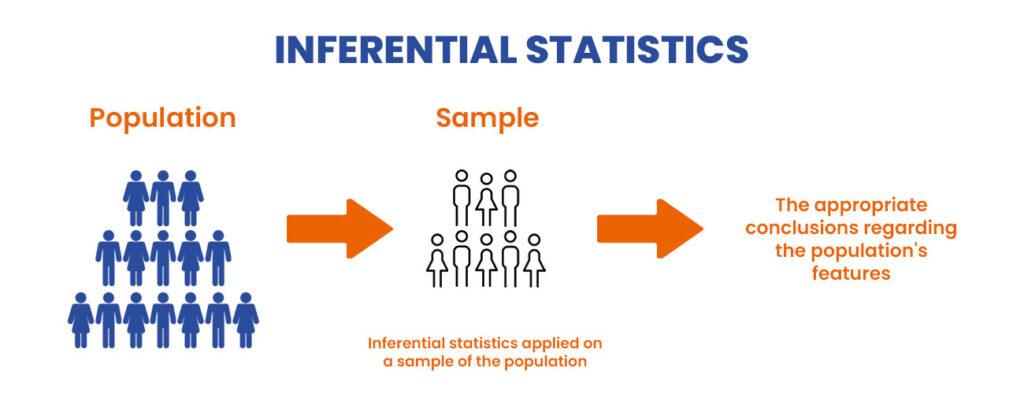
Inferential statistics involves using mathematical models and statistical methods to conclude a population based on a sample of data from that population. For example, suppose you wanted to know the average height of adult men in a certain country. In that case, you could take a sample of men, measure their heights, and then use inferential statistics to estimate the average height of all adult men in the country.
Inferential statistics are used in many areas, including medical research, market research, and social science research. Some common methods used in inferential statistics include hypothesis testing, confidence intervals, and regression analysis.
Inferential statistics is important because it allows researchers to make conclusions about large populations based on a smaller sample of data. This can be useful when it is not feasible or practical to collect data from every individual in a population, such as in medical research studies or large-scale surveys.
Difference between Descriptive and Inferential statistics
Descriptive statistics and inferential statistics are two branches of statistics that have different goals and approaches.
Descriptive statistics is concerned with summarizing and describing the main features of a dataset. This includes measures such as mean, median, mode, standard deviation, etc., representing the central tendency and dispersion of a data set. Descriptive statistics aims to provide a simple and concise summary of the data and to help understand the data through visual aids such as histograms, bar charts, and scatter plots.
Read More About Descriptive Statistics
Inferential statistics, on the other hand, is concerned with making generalizations about a larger population based on a smaller sample of data. Inferential statistics uses statistical methods to infer population parameters from sample statistics. This involves using statistical models to estimate and make predictions about population parameters based on the sample data. The main goal of inferential statistics is to make generalizations about a larger population based on a sample of data and to test hypotheses about population parameters.
Read More About Inferential Statistics
Characteristics of Inferential Statistics
Inferential statistics has several important characteristics:
Generalization: The main goal of inferential statistics is to make generalizations about a larger population based on a sample of data. Inferential statistics uses statistical models and techniques to estimate population parameters and make predictions about the population based on sample data.
Sampling: Inferential statistics are based on sampling, which involves selecting a subset of data from a larger population to represent the population as a whole. The sample data is used to make inferences about the population.
Probabilistic Approach: Inferential statistics is a probabilistic approach to data analysis, meaning that it deals with uncertainty and the idea that results are not certain but are based on probabilities.
Hypothesis Testing: Inferential statistics involves the testing of hypotheses about population parameters, such as the mean, median, or standard deviation. This consists of forming a null and alternative hypothesis and using statistical tests to determine whether the null hypothesis can be rejected.
Modeling: Inferential statistics uses statistical models to estimate population parameters and make predictions about the population based on sample data. These models can be simple or complex, depending on the nature of the data and the research questions being addressed.
Significance Testing: Inferential statistics involves significance testing to determine whether results are statistically significant, meaning that they are unlikely to have occurred by chance.
Types of inferential statistics with examples
Point Estimation
Point estimation is a statistical method used to estimate the value of a population parameter based on a sample of data. The goal of point estimation is to use the information obtained from the sample data to make an informed guess about the value of the population parameter.
There are two main types of point estimation:
- Maximum likelihood estimation (MLE): MLE is a method of finding the parameter values that maximize the likelihood function, which is a function that represents the probability of obtaining the sample data given the parameters. MLE estimates the parameter that is most likely to have generated the sample data.
- Mean squared error estimation (MSE): MSE is a method of finding the parameter values that minimize the mean squared error between the sample data and the predicted values based on the parameters. MSE estimates the parameter that results in the smallest average difference between the sample data and the predicted values.
Here is an example of point estimation using MLE in Python:
import numpy as np

from scipy.optimize import minimize_scalar

# Generate sample data

np.random.seed(0)

sample_data = np.random.normal(10, 2, 100)

# Define the likelihood function

def likelihood(theta, data):

    return np.prod(np.exp(-0.5 * ((data - theta)**2) / 2**2) / np.sqrt(2 * np.pi * 2**2))

# Use the minimize_scalar function to find the MLE estimate of the population mean

result = minimize_scalar(lambda theta: -1 * likelihood(theta, sample_data))

# The MLE estimate of the population mean is the value of theta that maximizes the likelihood function

print("MLE estimate of population mean:", result.x)
This code uses the minimize_scalar function from the scipy library to find the MLE estimate of the population means. The likelihood function takes a value for the population mean (theta) and the sample data as input. It returns the likelihood of observing the sample data given the value of the population mean. The minimize_scalar function minimizes the negative of the likelihood function, which is equivalent to maximizing the likelihood function. The value of theta that minimizes the negative of the likelihood function is the MLE estimate of the population mean.
Hypothesis testing
Hypothesis testing is a statistical method used to test claims about a population based on sample data. Hypothesis testing aims to determine whether the sample data provides enough evidence to support or reject a specific claim about the population.
There are two main types of hypothesis tests:
- One-sample tests: One-sample tests are used to test claims about the mean or proportion of a single population. For example, you might use a one-sample test to determine whether the mean height of a population is different from a specific value or whether the proportion of a population with a certain characteristic is different from a specific value.
- Two-sample tests: Two-sample tests are used to test claims about the difference between the means or proportions of two populations. For example, you might use a two-sample test to determine whether the mean height of one population is different from the mean height of another population or to determine whether the proportion of one population with a certain characteristic is different from the proportion of another population with that characteristic.
You may also like to read: Everything You Need to Know About Hypothesis Testing
Here is an example of a one-sample hypothesis test using a t-test in Python:
import numpy as np

from scipy.stats import ttest_1samp

# Generate sample data

np.random.seed(0)

sample_data = np.random.normal(10, 2, 100)

# Define the null hypothesis and the alternative hypothesis

null_hypothesis = 10

alternative_hypothesis = "not equal to"

# Perform the t-test

t_statistic, p_value = ttest_1samp(sample_data, null_hypothesis)

# Print the results of the t-test

if p_value < 0.05:

print("Reject the null hypothesis (p = {:.3f})".format(p_value))

else:

print("Fail to reject the null hypothesis (p = {:.3f})".format(p_value))
This code uses the ttest_1samp function from the scipy.stats library to perform a one-sample t-test. The ttest_1samp function takes the sample data and the null hypothesis as input and returns the t-statistic and p-value for the test. The t-statistic measures how far the sample mean is from the null hypothesis. The p-value is the probability of observing the sample data if the null hypothesis is true. If the p-value is less than 0.05, we reject the null hypothesis and conclude that the sample mean differs from the null hypothesis. Suppose the p-value is greater than or equal to 0.05. In that case, we fail to reject the null hypothesis and conclude that insufficient evidence supports a difference between the sample mean and the null hypothesis.
ANOVA
ANOVA (Analysis of Variance) is a statistical technique used to compare the means of multiple groups to determine if there are any significant differences between them. It is a hypothesis testing procedure that tests the null hypothesis that the means of all groups are equal against the alternative hypothesis that at least one of the means is different. ANOVA is used when there are more than two groups to compare.
import numpy as np

import pandas as pd

from scipy.stats import f_oneway

# Generate sample data

np.random.seed(0)

sample_data1 = np.random.normal(10, 2, 100)

sample_data2 = np.random.normal(12, 2, 100)

sample_data3 = np.random.normal(11, 2, 100)

# Create a dataframe with the sample data

df = pd.DataFrame({"data1": sample_data1, "data2": sample_data2, "data3": sample_data3})

# Perform an ANOVA test

f_statistic, p_value = f_oneway(df["data1"], df["data2"], df["data3"])

print("ANOVA (mean1 = mean2 = mean3):")

print("F-statistic: {:.3f}".format(f_statistic))

print("p-value: {:.3f}".format(p_value))
Chi-squared test
The Chi-squared test is a statistical test used to determine if there is a significant difference between a categorical variable’s observed and expected frequencies. It is a non-parametric test, meaning it does not assume a specific distribution for the data.
The Chi-squared test is used to test the hypothesis that the observed frequencies of a categorical variable follow a specific distribution, such as a uniform distribution. If the test results in a high Chi-squared value, it indicates that the observed frequencies deviate significantly from the expected frequencies and that the hypothesis can be rejected.
import numpy as np

import pandas as pd

from scipy.stats import chi2_contingency

# Generate sample data

np.random.seed(0)

data = np.random.choice(["A", "B", "C"], (100, 2))

# Create a contingency table with the sample data

contingency_table = pd.crosstab(index=data[:, 0], columns=data[:, 1])

# Perform a chi-squared test

chi2_statistic, p_value, dof, expected = chi2_contingency(contingency_table)

print("Chi-squared test (independence of variables):")

print("Chi-squared statistic: {:.3f}".format(chi2_statistic))

print("p-value: {:.3f}".format(p_value))

print("Degrees of freedom: {}".format(dof))
Pearson’s Correlation
Pearson’s Correlation is calculated as the covariance between two variables divided by the product of their standard deviations. The covariance measures how two variables change together, while the standard deviations measure the variability of each variable.
import numpy as np

import pandas as pd

from scipy.stats import pearsonr

Generate sample data

np.random.seed(0)

x = np.random.normal(0, 1, 100)

y = 2 * x + np.random.normal(0, 1, 100)

Perform a Pearson's Correlation test

r, p_value = pearsonr(x, y)

print("Pearson's Correlation (linear relationship):")

print("Correlation coefficient (r): {:.3f}".format(r))

print("p-value: {:.3f}".format(p_value))
These are just a few of the many statistical tests used in inferential statistics. The choice of test depends on the type of data and the questions being asked.
How do we use inferential statistics in Python?
Inferential statistics are used to make predictions or inferences about a population based on a sample of data. Several libraries and packages in Python can be used to perform inferential statistical analysis, including NumPy, pandas, scipy, and stats models.
To give a concrete example, let’s consider a scenario where we have a sample of 100 employees from a company, and we want to make inferences about the entire population of employees. We could use inferential statistics to answer questions such as:
- What is the average salary of employees in the company?
- Is there a significant difference in the average salary between employees with different levels of education?
- Is there a significant correlation between years of experience and salary?
Here is how we could perform such an analysis in Python:
Load the data: We start by loading the data into a pandas DataFrame.
import pandas as pd

# Load the data into a pandas DataFrame

df = pd.read_csv("employee_data.csv")
Exploratory Data Analysis (EDA): Before we make any inferences, we need to understand the data by performing some basic EDA, such as calculating summary statistics, creating histograms, and checking for missing values.
# Summary statistics

print(df.describe())

# Histograms

df.hist(bins=50, figsize=(20,15))

plt.show()

# Check for missing values

print(df.isna().sum())
Inferences: Based on the results of the EDA, we can make inferences about the population using different statistical tests. For example, to test the hypothesis that the average salary in the company is equal to $50,000, we could perform a one-sample t-test.
import numpy as np

from scipy.stats import ttest_1samp

# Define the null hypothesis (H0) and the alternative hypothesis (Ha)

H0 = 50000

Ha = "not equal to"

# Calculate the t-statistic and p-value

t_statistic, p_value = ttest_1samp(df["salary"], H0)

# Interpret the results

if p_value < 0.05:

    print("Reject the null hypothesis (H0)")

else:

    print("Fail to reject the null hypothesis (H0)")

# Print the t-statistic and p-value

print("t-statistic: {:.3f}".format(t_statistic))

print("p-value: {:.3f}".format(p_value))
Similarly, we could perform tests such as two-sample t-tests, ANOVA, or regression to answer other questions about the population.
Outcomes: The outcome of a statistical test is either to reject the null hypothesis or fail to reject the null hypothesis. In the case of the one-sample t-test, we reject the null hypothesis if the p-value is less than a significance level, typically 0.05, which means there is less than a 5% chance of observing the sample data if the null hypothesis is true. If we fail to reject the null hypothesis, there is not enough evidence to conclude that the population mean different from the specified value.
Interpretation: The interpretation of the results depends on the specific question being answered and the hypotheses being tested. For example, in the one-sample t-test above, if we reject the null hypothesis, we can conclude that the average salary in the company is different from $50,000. If we fail to reject the null hypothesis, we cannot conclude that the average salary equals $50,000, but we also cannot conclude that it is different. In other words, failing to reject the null hypothesis means there is insufficient evidence to support the alternative hypothesis.
It is important to remember that statistical tests are based on probability, so even if we reject the null hypothesis, there is still a chance that it could be true, and even if we fail to reject the null hypothesis, there is still a chance that it could be false. The results of a statistical test should always be interpreted in the context of the problem and the data, and it is always a good idea to validate the results using additional methods or data.
Conclusion
Inferential statistics is a powerful tool for making predictions or inferences about populations based on sample data. In Python, many libraries and packages are available to perform inferential statistical analysis, including NumPy, pandas, scipy, and stats models. Following the steps outlined above, you can perform inferential statistical analysis in Python, draw conclusions, and interpret the results.

I am having my internals tomorrow. And 20 minutes before , I had no idea how to pass but now I’m sure I’m going to get good marks .thankyou brainanalyst 👍
really helpful content tbh
Woah! such good content available for free, damn good content, great learnings 🙂
Being a statistics student myself, I can say that this was extremely helpful from exam point of view. Thankyou so much
Everything is so well framed that one can easily understand it.
Really an innovative blog full of knowledge and exposure. The concept has been detailed in depth
Thank you brainlyst for providing such detailed information about Inferential Statistics.
Great content with concise and clear knowledge. Thankyou brainlyst for the same..
Great content with concise and clear knowledge. Thankyou brainlyst for the same..